Canyon Hills Middle School
EPISD | 6th - 8th
Overview
The vision of Canyon Hills is that through engaging lessons, extracurricular activities and collaboration, students will be given opportunities to grow social-emotionally and academically while gaining the skills needed for the 21st Century.

School Programs
- 6th Basketball
- 6th Cross Country
- 6th Flag Football
- 6th Soccer
- 6th Volleyball
- Art Club
- Arts
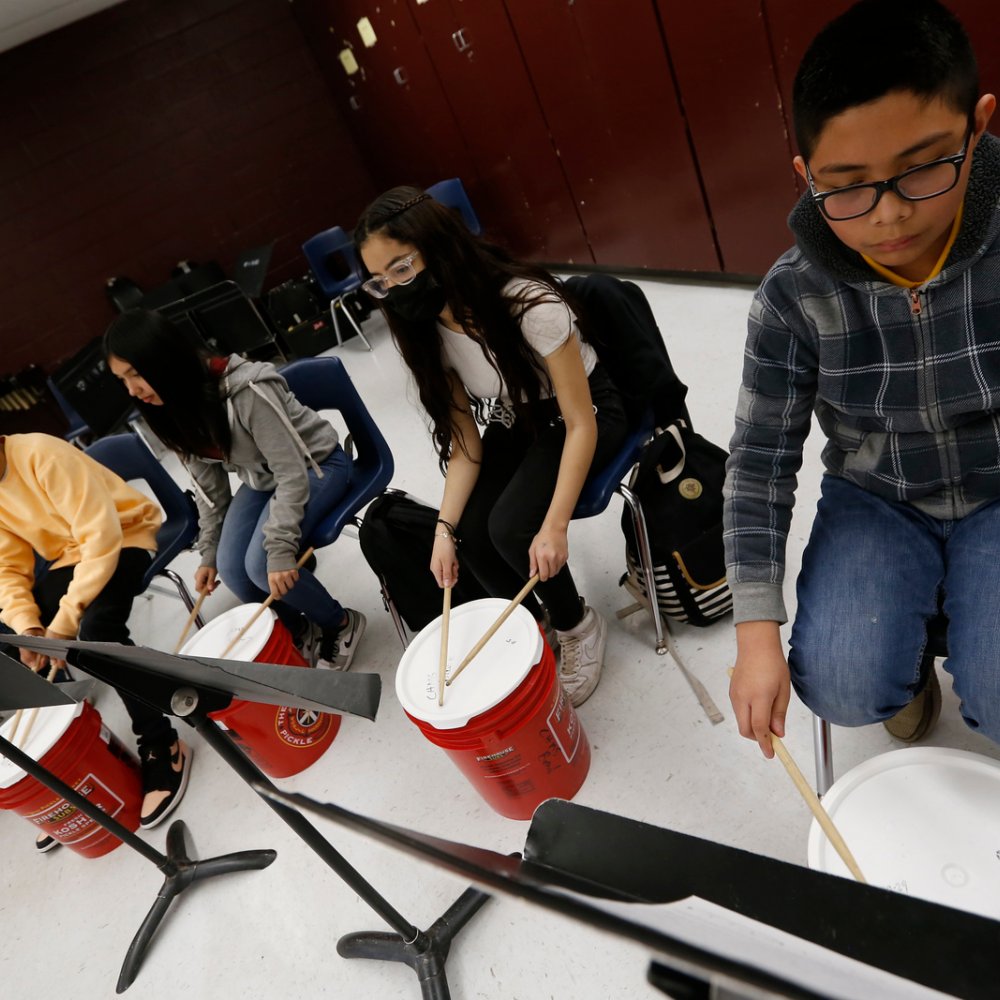
- Band
- Baseball
- Boys Basketball
- Boys Soccer
- Boys Track
- Cheerleading
- Chess Club
- Choir
- Cross Country
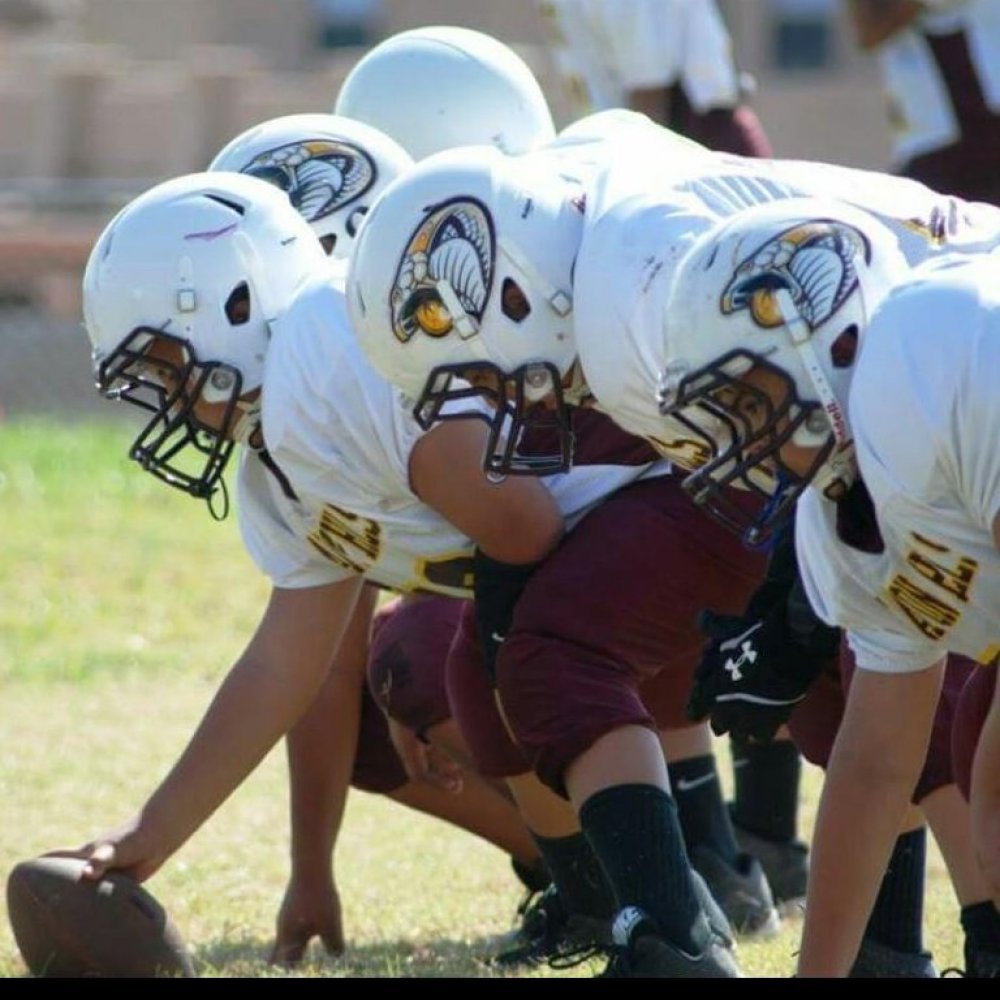
- Football
- Game Club
- Girls Basketball
- Girls Soccer
- Girls Track
- Math Club
- National Junior Honor Society (NJHS)
- Orchestra
- Poms Squad
- Robotics
- Softball
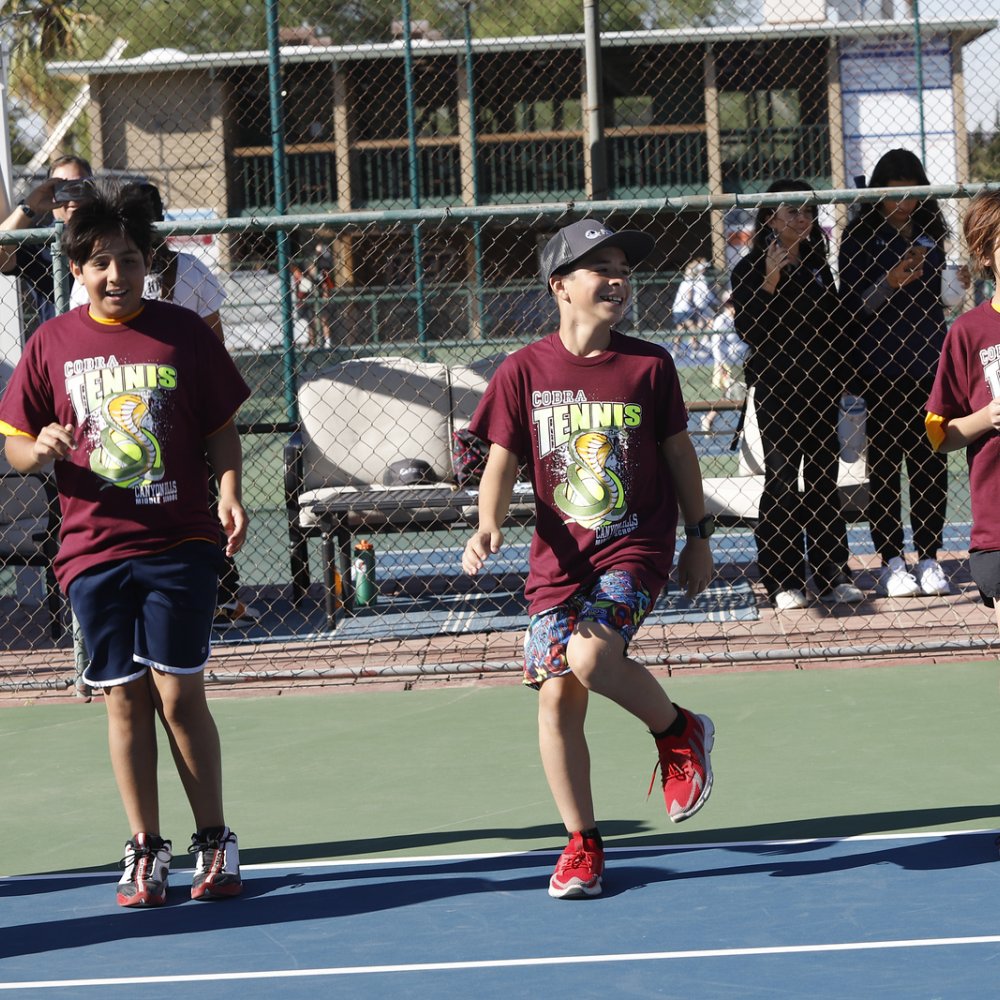
- Tennis Club
- UIL Literary Criticism
- UIL Mathematics
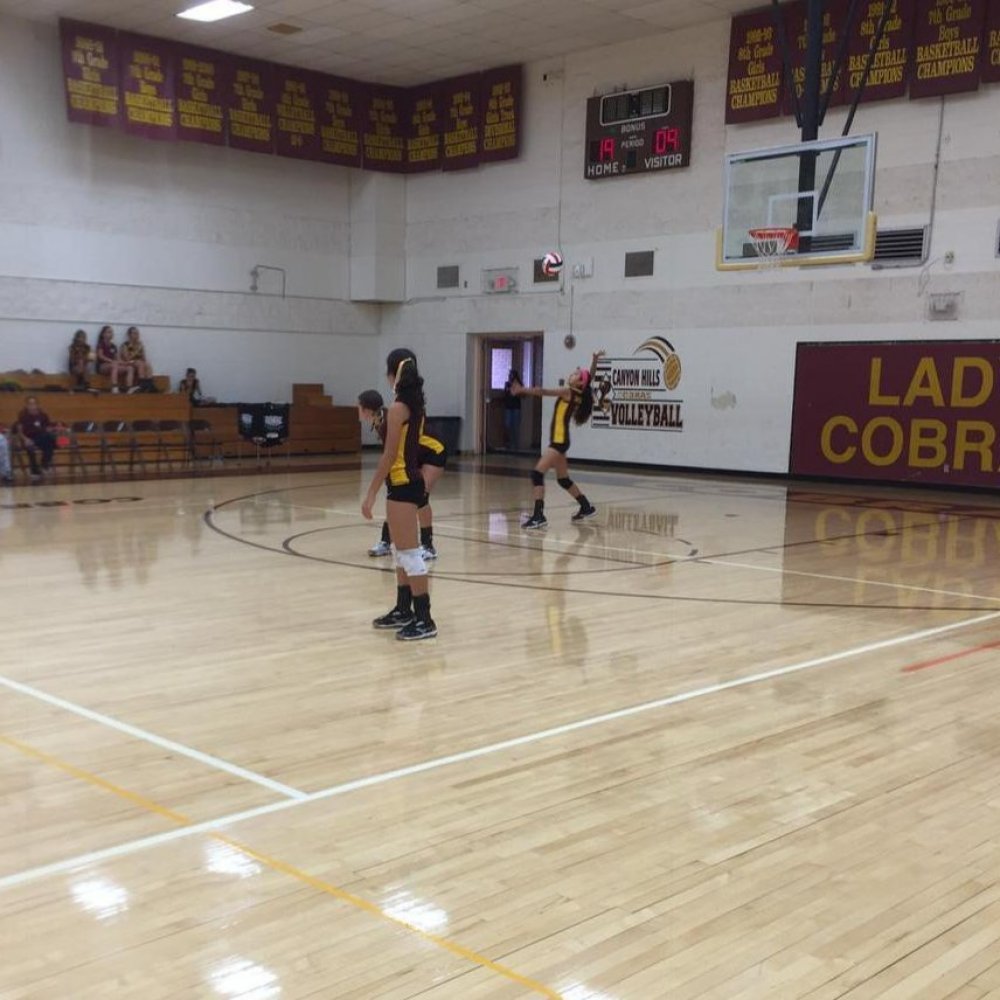
- Volleyball
- Wrestling
- Yearbook
School Features
- Traditional School
- Active PTO/PTA
- On-Site After School Care
- On-Site After School Programs
- Transportation Available
- 4-day School Week
- Intersession Calendar
School Demographics
# of Students Enrolled
408
# of Students per Teacher
14
% of Economically Disadvantaged Students
82%
% of EB Students
29%
# of Students Enrolled
# of Students per Teacher
% of Economically Disadvantaged Students
% of EB Students
408
14
82%
29%
El Paso School Finder continually updates our database to ensure the information we provide is accurate. Information is sourced from publicly available information and/or information provided by each school or school district. We recommend you always contact the school to confirm the information is still correct.